The Activity Report area of the Analytics Dashboard allows for highly customized reporting.
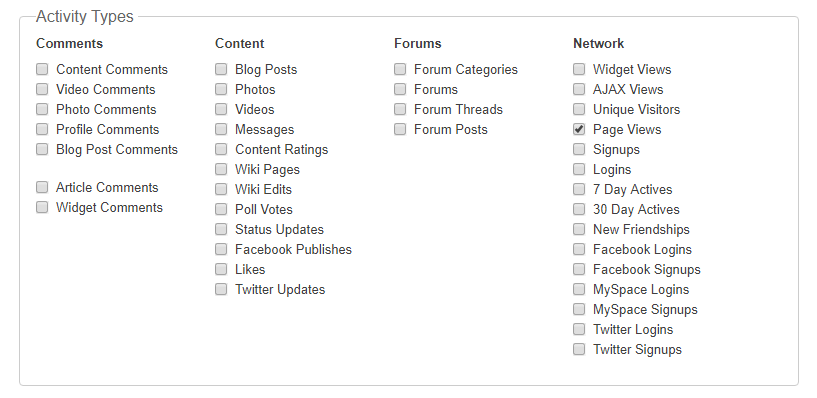
Reports are available for over 25 different types of data, including:
- individual comment types
- UGC content and actions
- forum activity
- network activity
Reports can be incremented in the following intervals:
- 15 minutes
- hourly
- daily
- weekly
- monthly
- yearly
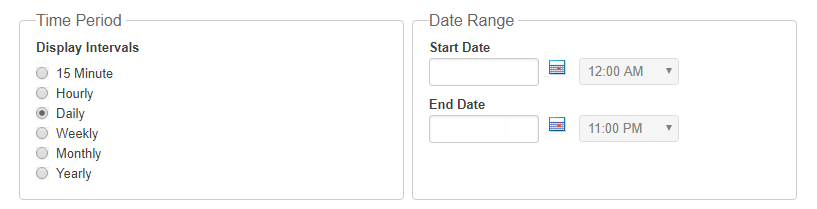
Once you have made your data and date range selections, hit Update to have your data plotted on the graph below.
Saving Your Custom Report
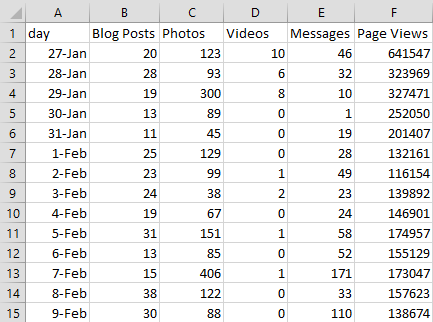
The Activity Report allows you to save any custom report you run as a CSV file. Simply click the Save button at the bottom of the report screen.

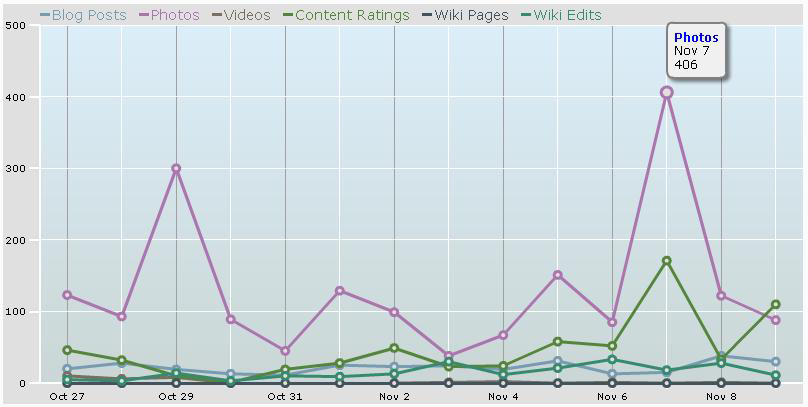
Once saved, the file will open in the program of your choice. In the screenshot below you see the results of a 2 week report that covers blogs, photos, videos, content ratings, wiki page creations, and wiki page edits.